
Currently we use CollectD’s uptime plugin to track system uptime. We then use Curl-Json along with Jolokia to get key metrics from our Java application server. One of these metrics is the JVM uptime, which, which we’ll discuss in this post. So here are the facts.
- The JVM uptime is reported in milliseconds
- System uptime is in seconds.
- Collectd’s reporting interval is set to 10 seconds
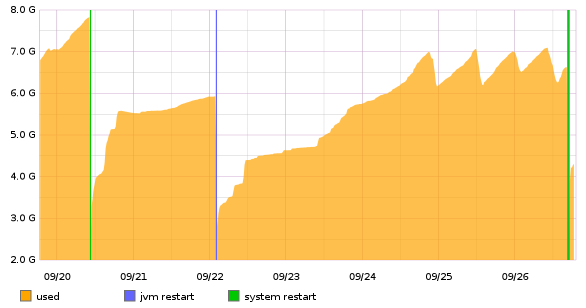
So in this contrived example I am going to plot memory used over a 7 day period on one of our test systems. I then wanted to show a vertical bar for any time the JVM or system is restarted. This way I can correlate these with any sudden changes I might see in memory utilization.
So lets build the request we would use to do this via Graphite’s Render API
Basics
https://graphite.mydomain.com/render/?width=500&height=600&from=-7days&until=now&areaMode=all&areaAlpha=0.7First we want to set the width, height, and window dimensions and areaMode for our graph. All of these are well documented and shouldn’t require much explanation.
Java process uptime
alias(
  drawAsInfinite(
    transformNull(
      removeAboveValue(
        test100.*.collectd.curl_json-javaVM.frequency-java_lang:type=Runtime-Uptime,
        100000
      )
    )
  ),
  'jvm%20restart'
)
So here we need to count any time the RMI returns a value less then 100 seconds as a restart, since I feel that this can never actually happen unless the counter were reset due to a restart of the JVM. We used a value of 100000 since the JVM uptime is reported in milliseconds.
System uptime
alias(
  drawAsInfinite(
    transformNull(
      removeAboveValue(
        test100*.collectd.uptime.uptime,
        100
      )
    )
  ),
  'system%20restart'
)
The uptime plug-in returns the system uptime in seconds, and because this starts accumulating collectd starts I found a value of 100 seconds to work great. Be warned your millage may vary, so you might want to try a higher value if you are not seeing anything at first.
System used memory
color(
  alias(
    test100*.collectd.memory.memory-used,
    'used'
  ),
  'orange'
)
Here we are just using CollectD’s memory plug-in to track used memory. We then change the color because I personally found the orange graph a little easier to read.
Hope someone found this helpful :)
